Global And China Economic Introduction
Global growth rate slowing to 2.4 percent in 2015 from 2.6 percent in 2014. It is estimated that global growth is projected to edge up, and is expected to reach 2.9 percent in 2016-17 and 3.1 percent in 2017-18. China.Even with the decelerated GDP growth rate which described as “the New Normal”. China’s economy is expected to grow between 5.5% and 6.5% annually. The chemical market in China is by far the largest in the world and will make up two-thirds of the total growth of the global chemical market over the next five years.
Global Organic Pigment Market Scale
2.1 Global and China Organic Pigment Market Scale
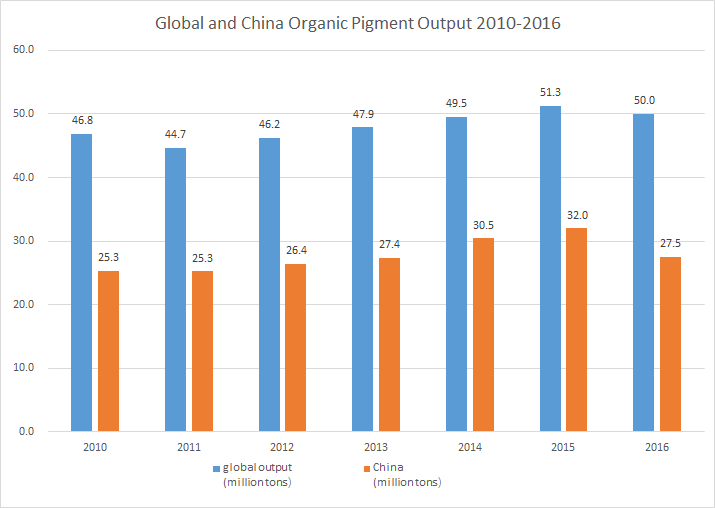
From the Year 2011 to 2016 period , As chart below

Source: 1. China Dyestuff Industry Association Organic Pigments Professional Committee (unit million tons) 2. China Customs Data
In the year 2010, global organic pigment output is 46.8 million tons (MT) and China produced 25.3MT among them, the next year 2010, global output declined to 44.7MT, China keep the same output as the year 2010, In 2012, global organic pigment output bounced back to 45.2MT and China increased to 25.4MT as well.In 2013, the increase continues, global data is 47.9MT and china production is 27.4MT.Next year, global output climbed to 49.5MT and China makes 30.5MT.In the year 2015, both hit its peak in period 2010-2016, global data is 51.3MT and China is 32.0MT. In the year 2016, with the environment administration been strict, a large number of small to medium factories been shut down and this year, global output is 50MT and China decline to 27.5MT.
There are 160-170 organic pigment manufacturers in China and among them, the first 40 factories take up about 80% total output. According to broker‘s data, there are 4000 pigment dealer and distributors in the market.
2.2 India Pigment Market Scale
India pigment market scale reaches 0.454 billion USD in the Year 2015.Among them, blue and green pigment take the majority in the color segment. For high-performance pigment which key intermediates import from China, it’s still in the incubation period.
Source: annual report of 2015-2016 Sudarshan
Global Organic Pigments Market By Application
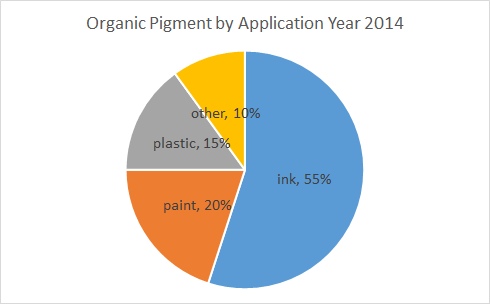
As chart below,which ink is about 55% ,paint takes about 20%,plastic is 15% ,other applications is 10%. The chart above represents overall structure recently. Segmentation by the application may vary in vendors and countries and shall change over time.
 Global Organic Pigments Market by Type
4.1 Classical pigment which stands for organic pigment excepts high-performance ones, it’s quantity ratio is 80-85%, sales revenue proportion is about 70-75%.
4.2 HHP abbreviation of high-performance pigment which includes high performance azo and high-performance heterocyclic, on the contrary, makes 10-12% in quantity while sales revenue proportion has reached about 25-30%.
5.Global organic pigments market trend
5.1 Organic Pigments Industry Trend
Before the 1980s, Europe and the United States had played a leading role in manufacturing. After the 1980s, production gradually transferred to Asia mainly China and India. In Recent years, there is a capacity excess of organic pigment worldwide. Industries in unorganized sector account for a large share in the production of pigments. This results in intense price competition in the commodity segments market.
5.2 Organic Pigments Technological Trend
There is still a big gap between China’s organic pigment industry compared with prominent vendors (BASF, Clariant, DIC). Though China’s organic pigment production and export volume ranked first in the world, it’s product structure still remains to be improved.
Global Organic Pigments Market Forecast 2017 to 2021
The global organic pigments market to grow at a CAGR of more than 3% to 3.5% between 2017 and 2021 main production areas includes China, India.we assume China pigment industry trends as follows
● the concentration of organic pigment segment will increase
● vendors getting lessen
● profitability getting better

 Global Organic Pigments Market by Type